Turn your research data into income-V2
Abstract
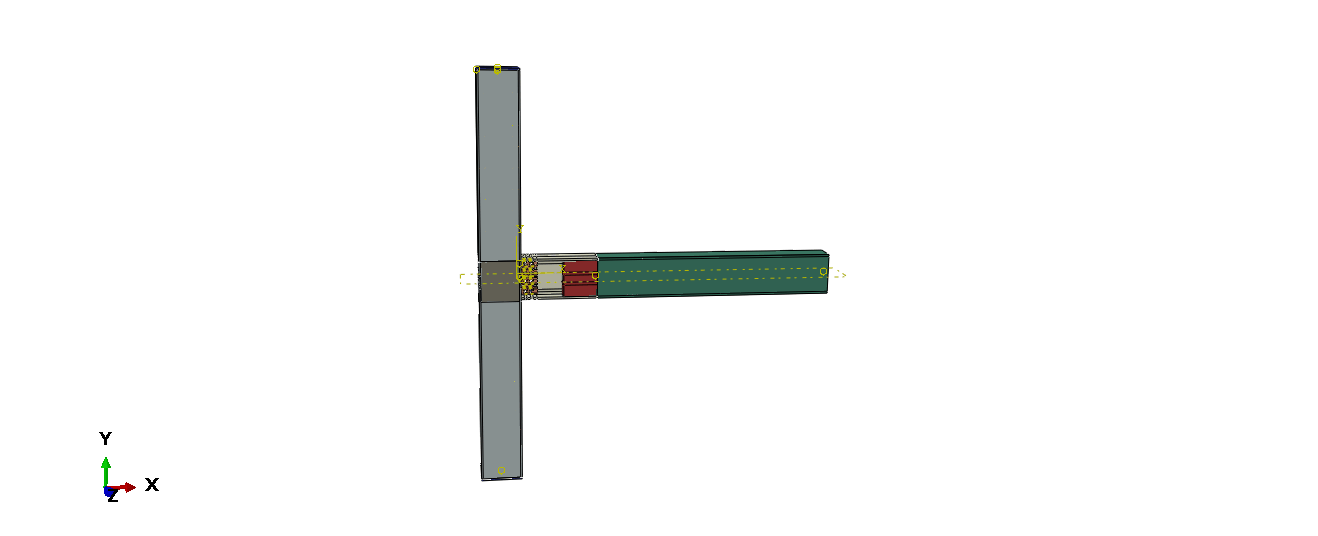
This study considers 4 experimental raw data and a survery of dataset. Stress-strain relationships of A1 and A2, R1 python file for distribution radar chart of Taguchi as a different variable data, and moment-curvature relationship of A1 were obtained. For the current study the fifth data of S1 was taken from a survey dataset of 500 responses. It is explained how the experimentally obtained raw data, code file of python and survery dataset are uploaded to the RDL platform.


There are 5 different data variables and a total of 8 raw data.


-Photoroom.png)